
 Facebook
 X
 Pinterest
 Copy Link
Three numbers came out of the October release in the Fredericton region. All three are correct. All three are described, somewhere, as the price of a house here. And they disagree with each other by more than ten percentage points.
The MLS® HPI benchmark was $368,400, up 4.0% on the year. The average sale price was $359,550, down 4.8%. The median was $340,000, down 6.2%.
One number says the market gained ground. Two say it lost. If you are pricing a house this month, which one you reach for changes the answer by tens of thousands of dollars.
So this is the month to understand what each of them is actually counting.
Start with the one that looks most reassuring
The benchmark is the number designed to be the honest one. Average and median move around with whatever happened to sell that month — a few expensive sales in Hanwell will drag an average up without a single house changing value. The benchmark is built to strip that out by tracking a consistent basket of typical homes, so it answers a better question: what is the same house worth now compared with before?
That is why it is the figure I use on the monthly market page and the one worth quoting.
And in October, it went up for a reason that has nothing to do with prices.
What actually happened to the benchmark
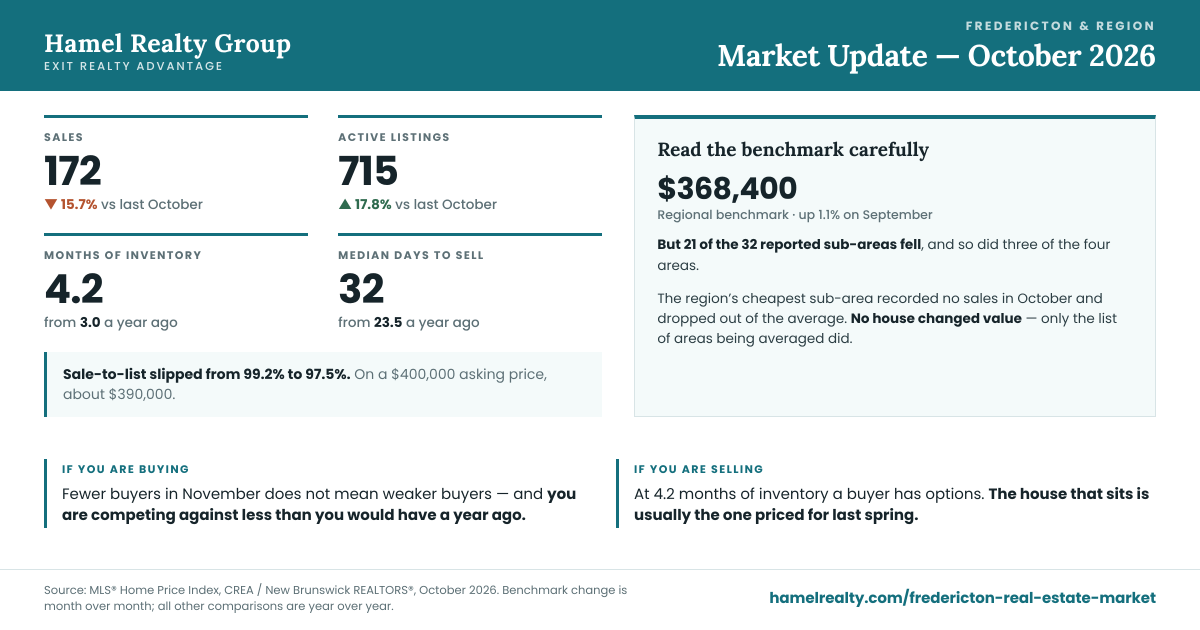
The regional composite read $368,400, up 1.1% on September.
Meanwhile 21 of the 32 reported sub-areas fell. So did three of the four areas — Fredericton North, Fredericton South and Oromocto & Area all moved down on the month.
Most of the region went down. The number for the region went up.
Here is how. The board reports Boiestown, Doaktown and Blackville as one sub-area, and it was the cheapest in the whole region at $171,000. In October it recorded no sales at all, so it was not reported, and the composite was calculated without it.
Take the lowest-priced member out of an average and the average rises. No house changed value. The list of areas being averaged changed.
You can see it in the arithmetic. Every reported sub-area in the Outside Fredericton group moved between +0.1% and +2.3% on the month. The group composite rose 4.8% — more than any of its own members managed. A weighted average cannot outrun its largest component, so that move is a change in the basket, not a change in prices. Outside Fredericton is what holds the regional figure positive, and the regional figure inherits the same distortion.
None of this is a flaw in the index or anything hidden. It is a normal consequence of a thin month in a small rural sub-area. But it means the headline number this month is not telling you what it usually tells you, and anyone quoting “Fredericton prices rose 1.1% in October” is repeating something the underlying data does not support.
Then why did average and median fall so hard?
For the mirror-image reason.
Average and median only know about the 172 homes that actually sold in October. They do not control for what kind of homes those were. When fewer expensive properties trade in a given month, both figures drop, and nothing has happened to the value of anyone’s house.
I want to be careful here, because the honest position is that the release tells you the averages moved; it does not tell you precisely which sales caused it. What I can say is that a benchmark rising while average and median fall by five and six percent is the signature of a change in the mix of what sold — not evidence of a market falling off a cliff, and not evidence of one climbing either.
Which number to use, and when
Pricing your own home: none of them. Use the benchmark for your sub-area, then adjust for your actual house. The regional composite is an average of thirty-odd very different markets, from the low $200,000s to the high $500,000s. It describes none of them. Every reported sub-area benchmark is on the neighbourhoods page, which is where I would start.
Understanding the direction of the market: the benchmark, read over twelve months rather than one. Month-to-month noise is exactly what this October demonstrates. Over the year the regional benchmark is up 4.0%, and that is a steadier read than any single month.
Average and median: context only. They are useful for seeing what is trading, not what things are worth.
If pricing is the live question for you, how to price a home in Fredericton goes through the whole method properly.
The numbers that were not ambiguous
While the price figures were arguing with each other, the activity figures were perfectly clear.
172 sales, down 15.7% on last October. 715 active listings, up 17.8%. Months of inventory moved from 3.0 a year ago to 4.2. The median time to sell went from 23.5 days to 32. Sale-to-list slipped from 99.2% to 97.5% — on a $400,000 asking price, about $390,000.
That is a market with more supply, fewer buyers and more room to negotiate than it had a year ago. There is nothing contradictory in it, and it is the part of the October release I would actually act on.
So did the fall market deliver?
Partly, and not in the way the headline suggests.
Sales were up on September. Inventory is healthier than it has been in years, which is good news for buyers and a harder trading environment for sellers who are priced to last spring. Prices did not collapse — but they did not rise 1.1% either, and a seller who takes that figure into a pricing conversation is starting from the wrong place.
The winter question — whether to carry a listing through to spring or come off and relaunch — is not changed by any of this. Fewer buyers in November does not mean weaker buyers. Nobody tours a house in a Fredericton February for entertainment, and the best time to sell in Fredericton goes through what the season is actually worth against what it costs you to wait.
Where to go from here
The full October breakdown — every reported sub-area, all four areas, benchmark by property type, and the sources — is on the Fredericton market update page. I rebuild it every month from the board release rather than summarising someone else’s summary.
If you want to know what your own house is worth against October’s numbers rather than the headline, start here. It is a conversation, not a form letter.
I answer my own phone — (506) 261-7373.
